


Cleaning MetricsChapter 1: Profitability
5 Easy Steps to Knowing How Profitable Your Janitorial Company Is
Janitorial company owners come from a variety of backgrounds. So it’s hard to say where the skill set of any one business owner lays. That being said, we here at Swept hunkered down and did some homework on the kind of metrics that would add the most value to their daily lives. First up to bat, Profitability!
Running a business means that you need a certain degree of know-how with dollars and sense (see what we did there), but not everyone will be comfortable or even have the time to monitor their company’s overall financial health. Looking at how many facets, accounts, deductibles, numbers, amounts owing, arrears, etc, can be daunting, and difficult to keep track of. This guide will serve the purpose of giving you a bird’s eye view of the big-picture, and empowering you to maintain profitability.
What you can expect from cleaning metrics chapter 1:
-
Understanding Your Operating Expenses
-
Analyze your Gross Profit Margin
-
Know Your Net (Profit Margin)
-
Per-Location Profitability
-
Projecting Your Prospects

1. Understanding Your Operating Expenses
Revenue increasing but profit decreasing? Seeing fluctuations in your profit in spite of steadily increasing revenue? More often than not, the answer to this pickle can be found in your expenses. Are they going up at a faster rate than your revenue? When janitorial companies are in a growth stage, it’s easy to forget to ensure you aren’t spending more than you’re making.
Try looking at your average month-over-month expenses in comparison to average revenue for the same time period. Keep your eyes peeled for patterns and trends. Are expenses quickly gaining on your revenue, or even surpassed them already? If you caught an unhealthy expense pattern, its time to course-correct and act quickly to balance them out. It may seem like common sense not to let your spend outweigh your gain, but it’s not always easy to catch when you aren’t specifically looking.
Check out some of these free Profit and Loss Charts to make this step easier on you.
Once you notice a steady balance, you can start predicting your profit better, and avoiding pitfalls well before you arrive at them.
Of course, it never hurts to have some accounting software handy as a second set of eyes on what finances are coming and going from your company.
2. Diagnose Your Gross (Profit Margin)
Gross profit is potentially a strong indicator of your profitability. When viewing total income after deducting the cost of supplies, payouts, and other potential business associated costs you may incur. Doing the math is fairly straightforward, but much of the time with cleaning companies, especially with supplies, it can be hard to keep track of all the supplies bought in a given month or year. To calculate gross profit:
Revenue – Cost of Supplies/Expenditures = Gross Profit
Be sure to include payments to cleaners, supplies, and any additional expenditures you may have when doing this math. If you miss some massive expenditures like wireless vacuum’s for all locations, your results will be far from accurate.
Gross Profit Margin should identify the percentage of profit you’re retaining, compared to how much your business is costing. The formula is:
Gross Profit / Revenue = Gross Profit Margin
A higher percentage means you’re keeping lots of profit compared to product cost. Anything less than 50 percent means your product is costing over half of your sales revenue.
A lower percentage is fine as long as your sales volume is high enough to pay your expenses. What gross profit margin shouldn’t be doing is decreasing. If that’s happening, it’s time to raise your prices or find ways to cut product costs.
Is your gross profit margin good but your net profit is decreasing? The best idea is to take a look at your overall expenses, like overhead. Product cost isn’t your problem.
3. Don’t Fret Your Net (Profit Margin)
Net Profit is a paramount number in identifying your company’s profitability. Just like above the equation is pretty straightforward”
Revenue – Expenses = Profit
Say a company that has with revenue of $86,000 in annual revenue, and incurs $66,000 in expenses. That company has an annual net profit of $20,000. Easy peasy right?
Here is a handy free calculator you can use. A positive number means you’re turning a profit. If it’s a negative number, your business is losing money. Zero means you’re breaking even.
Now as contracts come and go frequently in the janitorial industry, and cleaner turnover rate can be as high as 300%, It’s vital to look at profits on a monthly basis in addition to annual. Check the month over month profitability can help you see patterns in your industry like seasonality, end-of-quarter, or tax season (these affect the way your customers spend their money). Having market trends fresh in your mind can help you make better decisions with better results!

4. Check Formation of Profit Per-Location
Not every customer/client is made equal. Some generate more profit than others while others can be “tire kickers” and cost you more in terms of hours and attention. A clever business good owner needs to be aware of which clients are bringing in the most profit, and which ones cost more than they are worth.
Occasionally a client that seems to generate the most profitable, can be the worst ones to have. Even if you’re charging these clients more, you could be suffering more expenses than you realize. Often you refer to these as healthy customers and unhealthy.
Knowing your profit per location/client is vital to success. Here’s the basic equation.
Total Location Income – Total Location Expenses = Gross Profit Per Location
5. Project and Protect all Aspects of Your Prospects
There are a lot of variables that will cause fluctuations in your company’s income. Some can be predicted such as seasonality, and some (called an X-Factor) cannot. Try to be prepared for X-factors, but concern yourself more with the variables you can control. Your company’s Profits should be as evenly dispersed throughout the year to help with cash flow. Of course, the best-laid plans of mice and men, as they say. In other words, things can, and often will go wrong. That is the nature of running a business. But you can reduce the harm caused by unexpected pitfalls by being aware of everything mentioned above, and expecting the unexpected.
Make plans to increase your marketing in months you know are traditionally slow business months, or head out and do some networking. Conferences like ISSA are great for drumming up new time-saving tech, new business, and potential new partners. Another good idea, don’t putt all your eggs into one basket. Security and reliability are great things to have in business, but of your cleaning company depends on a single company to survive, then that company is solely going to control your income, growth, and success. Which kind of defeats the purpose of owning your own business doesn’t it? If you know this customer to be reliable and have a good, trusting relationship, then great. But the fewer customers you have, the greater the potential risk to your success.
This brings the first chapter in our Metrics that Matter series to an end. Did you find this helpful? If you did, we’re happy to say we have 4 more chapters coming our over the next several weeks covering a wide variety of metrics that will guide your company to greater success through greater knowledge!

Chapter 2: Losses and Wins
How To Learn From Your Achievements and Missteps
Growing your business means setting goals and measuring your success. As we’ve spoken about before, there’s no real way to measure your goals without first benchmarking (that’s a way of recording your starting point), then looking at data on a regular basis. The second kind of metric we want to look at regularly is the percentage of contracts you’re winning, along with contracts you may be losing. This will help you calculate your overall net growth, but it will also help you to measure if you’re reaching a specific goal of, for example; winning 80% of the new business you bid on each quarter. Assuming that growing your business is a goal, winning new contracts would be part of that, and that’s why this metric is super important.
Also — losing more contracts than normal, or in a way that hurt your overall goals, raises a red flag that something isn’t working. Keeping track of the health of your existing contracts is a way to ensure you aren’t surprised by losing business. More on that later.
In this chapter we’ll talk about:
-
Setting cleaning metrics goals and measuring your success rate.
-
Looking at lost business.
-
Keeping your existing clients happy.
-
Refresher: Bidding on New Business

Let’s start at the beginning. You probably have an idea of how much you want to grow your business in 2020. You’ve thought about the important factors like how many new cleaners you’d need to hire to grow your business, how to manage your cash flow in order to take on new cleaners, and overall how to manage the kind of growth you want. If not — we cover those topics in the second part of this blog post.
Set Your Winning Goals
Let’s look at the last year. Answer these two questions:
-
How many new contracts did you bid on this year?
-
How many of those did you win?
Now, divide the amount of contracts you won by the overall number you bid on, and multiply that by 100. That’s the percentage of new contracts you won. That’s your success rate. Did it meet your goals? Did you have goals? If not, it’s time to set those goals for 2020.
Once you’ve considered the factors we mentioned above about how much growth is realistic for your cleaning company, take a look at your success rate from 2019 on bidding on new contracts. If it’s 60% or less, there’s definitely room to aim higher. Consider what your goal looks like in terms of the number of contracts you’ll bid on. Of course, the size of the contract matters, too. Your goal could also be to win one very large contract, which will increase your overall net sales. Goal setting is different for every cleaning company, depending on many different factors. The point is that there are measurable goals in place and metrics to look at, in order to move forward.

Lost Business
Not every lost contract means Game Over, On the flip-side, if you subtract your winning percentage from 100, you’ll see the percentage of contracts you lost. If the goal is to win 80% of the new business you bid on, then, of course, the other goal defaults to not losing more than 20% of those new contracts. Tracking your unsuccessful pitches is important in order to shrink that percentage, meet your goals, and of course to evaluate why you were not successful and what you might need to change in order to win the next time.
But… it’s not all about new contracts. The other lost business metric to look at is what percentage your existing contracts did you lose. Why did you lose them? Is this percentage healthy, average, or does something seem off?
Keeping Clients Happy
Retaining your existing clients is a big part of reaching your overall net growth goal. Part of your goal setting should be to calculate the sales you already have coming in, assuming you will do everything to keep those contracts, and growing the business by winning new contracts. Of course, if you operate in an environment where certain contracts are cyclical or fickle, you can work those estimates into your goal-setting in a realistic way, this will ensure better forecasting.
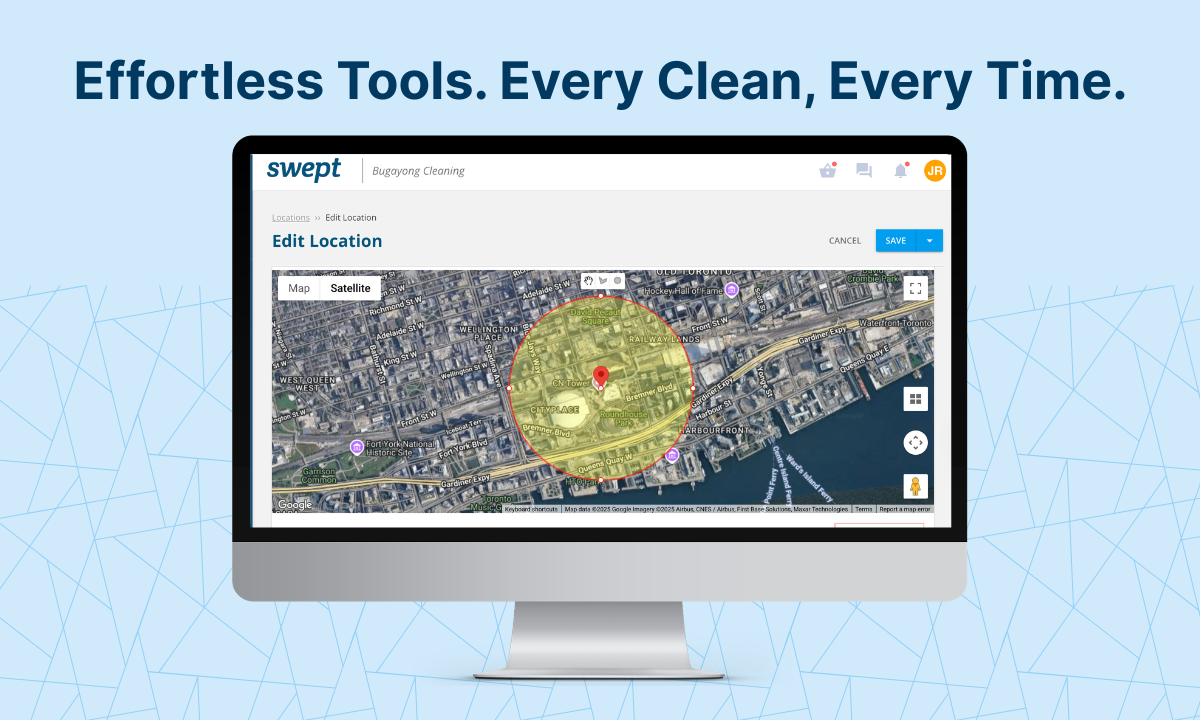
Swept now offers Metric Cards in our latest 4.5 update — these give at-a-glance insight into the health of your existing relationships with clients. A handy way to keep track of how you’re doing, which allows you to be proactive and fix any problems before it comes to the termination of a contract. If you aren’t using janitorial software like Swept, find a manual way to keep track of these health metrics and check in on a regular basis with your clients. Start by finding out which of these metrics matter most to these clients.
One: Self Evaluate
Start by looking at what you have to offer to potential new clients. Are you easy to find online? Does your website cover reflect who you are as a company? Is it easy to read and find contact information? Set yourself up for success from the very first touchpoint.
Two: Competitive Analysis
Do you know what your clients are offering? How will you stand out? Know your competitor’s pitch.
Three: Calculating Quotes
Surprise! We already have an app for that.
Four: Proposal Template & Sales Pitch
Have a nicely designed proposal template in order to put your best foot forward! There are several resources online, including Proposify.
Perfect your sales pitch with these top tips:
-
Reframe the discussion.
-
Only talking about actual cleaning for 15-20% of the conversation.
-
Know your competitors pitch well, and make yours different.
-
Don’t lean too hard on common interests, as they might use a personal connection against you in negotiations.
-
Control the pricing upfront.
-
Reframe industry expectations — ask them questions, and really listen to the answers.
-
Show them how you can solve those problems.
-
Let them experience your process.
-
Create trust through proof that you are different.
-
Stop racing to the bottom for price.
-
If you practice your pitch, you will win.
Learn more here:
Five: Managing Growth
When setting your goals and reaching for them, have the right processes in place so that you are able to take on the new business. This includes getting set up for cash flow and human resources properly.

Chapter 3: Staff Retention
How to Hold on to Your Valuable Employees
Owning and operating a cleaning company, you’ve probably spent a lot of time hiring and training new workers. And as you know, that takes up valuable time (especially your own—unless you have a human resources department), effort and resources. You may also know that employee retention is known to be one of the top problems for cleaning company owners and managers (our own 2018 Report – The State of the Janitorial Business showed 17% of owners listed it as their biggest challenge).
In order to cut down on time spent recruiting and training, shift part of your focus toward employee retention. (That is, getting cleaners to stay with your company.) Having cleaners you’re happy with stay for a long time (hopefully forever!) means a lot less stress for you, less money spent on human resources management, and more consistent cleaning service.
In order to set goals around human resources, you must first benchmark where you’re at. Since this chapter focuses on employee retention, we’ll specifically look at what your current employee retention rate is, what that means, and how to improve it. We will also touch on employee turnover rate. This is another example of using data you have access to, to your advantage. Let’s look at the numbers to help strategize and grow your business!

Employee Retention 101
As you know retention means keeping your cleaners working for you. Once you understand what retention is and why it’s important, it’s time to benchmark. You might have an idea of your current retention rate, or it could be something you’ve never really thought about — either way, we’re going to show you how to calculate it, as a starting point.
Cleaner retention is a big sticking point within our biz, with the janitorial industry having the highest annual turnover rate for any working sector in North America. It can be as high as 300%… that’s 245% higher than ane highest average of any other sector.
Retention Rate
# of individual employees who remained employed for entire measurement period /
# of employees at start of measurement period) x 100
Tip: Only include employees who were employed on the first and last day of the measurement period. We want to look at who you retained, not who you recruited during that same period.
How do you decide on what the measurement period is? Well, the norm seems to be to measure by the year. However, if you just started looking at this data and are curious on a quarterly basis, there’s nothing wrong with calculating it more often, every three months. Especially if you line up the measurement period with a new human resources tool or initiative, for example, you introduce weekly staff meetings, quarterly reviews or even team-building outings. Looking at your data against when you’ve introduced new tools is a great way to measure success and efficacy of these efforts.

What’s the Difference Between Retention and Turnover?
Great question. Although some people use these terms interchangeably, they are different (actually, opposite) and should be treated as such. To calculate your employee turnover rate, the formula is:
# of separations during the measurement period /
average # of employees during the measurement period x 100
This could also be found by backing out your retention percentage from 100; if you retained 30% of your staff during a measurement period, then you turned over 70%.
A separation, of course, is a nice way of saying someone left the company—for whatever reason. It’s important to take notice of your turnover rate and know if it’s higher or lower than your regional industry average. If it’s higher, that’s a red flag, and you may need to investigate why this is the case and how you can improve. If it’s lower—congratulations, that’s something you can be proud of, and mention in your recruiting program. If it is indeed lower, you also want to investigate—what are you doing differently than other companies? How can you use this same kind of attitude or practice in other ways? It is a transferable skill or policy?
Retention in the Cleaning Industry
Looking at various studies, the average cleaner turnover rate fluctuates from 75% to 375% annually — we don’t need to tell you that’s high, overall. As a starting point, calculate your rates from 2019. Now is the time to set goals for 2020. If you’re not quite sure where to start, it’s probably safe to say you could aim to have higher retention and lower turnover, whatever that looks like for you. Improving on these means saving money and growing your business.
It’s also fair to point out that the entire recruiting and training process can help to increase employee retention. More on that below:
The Recruitment Funnel
In order to understand the entire process of recruitment, we’re going to look at something called the recruitment funnel. [insert graphic] This funnel shows the path that a potential job candidate follows on their way to becoming an employee of your janitorial company. When thinking about employee retention, our focus goes to the very bottom of the funnel — advocacy.
To create an environment where an employee will advocate for your company (and essentially help recruit new cleaners) certainly means that you have a great chance of retaining that employee for a very long time. The following human resources initiatives can help to foster advocacy, thus improving employee retention.
Turn an Employee into an Advocate for Your Cleaning Company by:
-
Having a smooth onboarding process
-
Having an effective training process
-
On-going training and education
-
Quarterly reviews
-
Foster an environment where employees are heard
-
Implement ideas that come from your team
-
Take action to solve problems
-
Have open lines of communication within the entire company
-
Give staff room to grow (promotions, incentive programs, etc)
-
Design an employee recruitment program

Chapter 4: Client Retention
Hang On to Your Clients
Ready to touch on a very, very important analytic? How many clients you’re keeping (retention rate), and alternately, how many clients you’re losing (attrition rate). Being so close to the operation, you may feel that you already have a handle on client retention, and fair enough, you likely have a gut feeling that isn’t too far from reality, but, do you actually calculate your client retention rates? On a regular basis? Do you set goals around improving? On top of all that — do you know what a healthy client retention rate even is for a cleaning company? These are all metrics that you should be aware of and clearly tracking, in order to grow your business and move forward. And we’re here to help!
First of all, why do we need to look at client retention?
Fact: Keeping customers is faster and easier than trying to get new ones — and also costs five to 25 times less!
Think about the entire process of making cold calls or bidding on requests for proposals in order to get new business. This involves getting to know new potential clients, and following all the rigorous steps of trying to win new contracts. If you’re constantly losing clients and then having to go through the process of getting new ones in order to meet your sales goals, you’re spending a lot more time and money than if you simply retained a higher percentage of your existing clients.
Clients you’ve already been working with know you, know your cleaners, and you already have contracts in place and a relationship to build on. It’s much easier to renew a contract and simply negotiate new terms than go through the entire sales process from step one. (Not to mention keeping existing contracts means less training for the cleaners.)

Calculating Client Retention (CRR)
The formula for calculating client retention is:
Retention rate = ((CE-CN)/CS))100.
CE = number of customers at end-of-period
CN = number of new customers acquired during this period
CS = number of customers at start-of-period
Don’t worry, once you fill in the formula and get familiar with it, it’s not as hard as it looks. (We don’t love math either.) Let’s use an example below…
Say you start the period (first quarter) we’re measuring with 100 clients. Over the first quarter, you lose 5 of those clients, but gain 15 new clients. At the end of the first quarter, you have 110 clients total.
So, 110-15 = 95. Then 95/100 = 0.95, and 0.95 x 100 = 95. Which means 95%. Your retention rate for first quarter was 95%.
Client Attrition Rate (AKA: Customer Churn Rate)
The opposite of the retention rate is the attrition rate — also called a customer churn rate. Client attrition happens when you lose a contract, and the relationship ends. If your client retention rate is 95%, as per the example above, then your attrition rate must be 5%.
It only makes sense that to grow your business and to be more profitable, you want to shrink your attrition rate as much as possible. The fact of the matter is keeping existing clients is valuable to your company, and you’ll see it on your bottom line.
Stat: In the United States, an estimated $83 billion is lost each year due to poor customer experiences and customer attrition.
Benchmarking
Yes, we’re talking about benchmarking again. Now that you’ve calculated your retention and attrition rates for 2019 (or whatever period you’d like to benchmark) you can really start measuring your progress. While of course, 100% is the ideal retention rate, it may not be realistic for your industry. Start by looking at what your benchmarked percentage is, and getting better from there. Measuring quarterly is a great way to stay on top of things. If you’re not meeting your goals, make sure you reflect on why that might be.
Stat: ROI: A 5% increase in customer retention can increase company revenue by 25-95%.

Ideas to Help Keep Clients
So, now that we know keeping existing clients means a better ROI for your janitorial company, how do we go about doing that? Here are a few ideas to start you off:
-
Start with onboarding. Teach your new clients about how this relationship is going to work, and set realistic expectations.
-
Customer feedback and surveys. The learning process is never-ending.
-
Open lines of communication. This can mean one-on-one meetings, scheduled check-ins, or even newsletters.
-
Client loyalty incentives. Treat your long-time clients to some well-deserved perks.
-
Ongoing client education. Making changes? Keep everyone in the loop to avoid confusion or frustration.
-
Empower your client with the right tools.
Stat: According to Mixpanel’s 2017 Product Benchmarks report, for most industries, the average customer retention rate was below 20%.

Chapter 5: Business Development
Fuel Your Grow With Know
As a janitorial business owner, you probably hear people toss around terms like “growth”, “ROI”, and “business development” a lot. In this chapter of Metrics That Matter, we’re going to put the term “business development” into a perspective as it relates to the commercial cleaning industry.
In the literal sense of the term, “Business Development” refers to what you’re doing to develop your business (and by “develop”, we mean “grow”). There are lots of tools out there that can be used to grow your business. For the sake of context, we’re going to look at business development specifically in the sense of getting new business.
Let’s start by looking at some of the first touchpoints for new potential clients:

Common Business Development Tools:
-
Website
-
Newsletter Subscribers / E-blasts
-
Social Media
-
Sales Calls/Cold Calls/Meetings
-
Networking – In Person, or on LinkedIn
-
Print Advertising
Whether you have a designated sales and/or marketing person at your company, or, in most cases, that’s you (we know you wear many hats), checking in on these basic business development tools is a great place to start. Without these tools, you’re missing out on the opportunity to spread brand awareness about your cleaning company and draw the attention of potential new clients. Word of mouth is great, but it’s not enough in a competitive environment like the professional janitorial industry.
Understanding Business Development KPIs
Another word for “metric” is Key Performance Indicator (KPI). In this chapter we’re going to dive into business development KPIs and talk about why you should be measuring them on a regular basis.
Benchmarking
As usual, to get anywhere, you need to benchmark. As we look through these five major business development KPIs, you should first calculate where you were in the last measurement period (whether that be a month, a quarter, or a year) so that you can compare over the next measurement period, and assess your progress and growth.

Looking at KPIs
1. Sales Targets
You probably have a good sense of where your sales are at currently, and where you want them to be. Setting sales targets is exactly how it sounds, you just need to decide on your measurement period, and what you’d like the company to reach for sales over that period of time. It’s important here to be realistic, but still look for growth. Decide if you’d like the target to be a dollar value, or the number of new contracts won.
2. Sales Pipeline
Your sales pipeline shows what your cleaning company has in “active opportunities” at each stage of the sales process. This is much easier to track if you’re using a Customer Relationship Management (CRM) Dashboard or similar technology to support your business development efforts. Creating a sales pipeline really gives great visuals on how active you or your sales team are at any given time.
According to the Hubspot Blog, these are the Five Steps to Building a Sales Pipeline:
-
Define the stages of your sales cycle.
-
Identify how many opportunities typically continue to the next stage.
-
Work backward to calculate the number of opportunities you need at every stage to hit your revenue goals.
-
Pinpoint the common characteristics of opportunities that convert for every stage — both actions the rep takes (like sending a follow-up email) and prospect responses (agreeing to a demo).
-
Create a sales process or adapt your existing one around these actions and numbers.

3. Number of Leads per Month
This is an easy one to set up, but super important to track. As you know, it’s easy to get bogged down in day-to-day activities, and putting out fires. You may forget to look at the number of new business leads you’re actively getting each month. If you lose track of your new leads, you’ll lose track of your overall growth and lose sight of your goals.
Take it to the next level: categorize your leads by how they came in! Then you can put values on your respective business development tools.
4. Leads Presented to Leads Worked
Getting new sales leads presented is fantastic — it’s what every business owner wants. But if no one is “working” those leads, what happens? Nothing. That potential client ends up contacting your competitor instead, because no one worked the lead. Once you start tracking the number of leads per month coming in, you can in turn track the percentage of those leads that were properly followed up, or, “worked”.
First, pick a measurement period, let’s say last quarter, then use this simple equation to find out the percentage of leads that were worked.
(New Leads Worked / All New Leads) x 100 = Percentage of Leads Worked
5. Lead Close Rate
We touched on this already in Chapter Two, where we talked about contracts won and lost, and how to calculate those metrics. Here, we’re looking at it slightly differently. We’re tracking the overall amount of leads coming in (whether you initiated the lead or it came in through one of your business development tools, like your website), how many leads of those were worked by you or your sales team, and now, how many leads you closed. The percentage of leads closed is a great KPI to look at, as it helps to show the effectiveness of your sales strategy.
All Good Things
Of course, that doesn’t mean you should stop finding new and interesting ways to grow your business through a better understanding of how paying attention to the small things, can make a big difference.
Swept is dedicated to highlighting stories that touch everyone in the janitorial industry. Having started as a commercial cleaning company ourselves, our hearts go well beyond the janitorial software we offer. Learn more about Swept’s cleaning company software here.